
Defining a ROI
To import an externally generated ROI mask please refer to the integration section.
Fly-QMA includes a matplot-lib based GUI for selecting a particular region of interest within an image layer. The interface consists of a grid of images in which rows correspond to layers and columns correspond to each of the available fluorescence channels. To launch the GUI for an individual image stack:
>>> from flyqma.selection.gui import GUI

>>> # load a stack, including its image
>>> stack = experiment.load_stack(stack_ind, full=True)

>>> # create the GUI interface (a still image)
>>> gui = GUI(stack)

>>> # connect interface to user input
>>> gui.connect()
Regions of interest are selected by drawing a selection boundary that encloses them. A selection boundary is defined by a series of sequentially-added points. Click on a layer image to add a point to that layer’s selection boundary. Points may be added to any of a layer’s fluorescence channels, and will automatically appear withing all other fluorescence channels for that layer. The most recently added point appears as a large red dot, while all other points appear as small yellow dots. Once three or more dots are present in an image layer, the current selection boundary is displayed with a yellow line. Once completed, a given layer might look like:
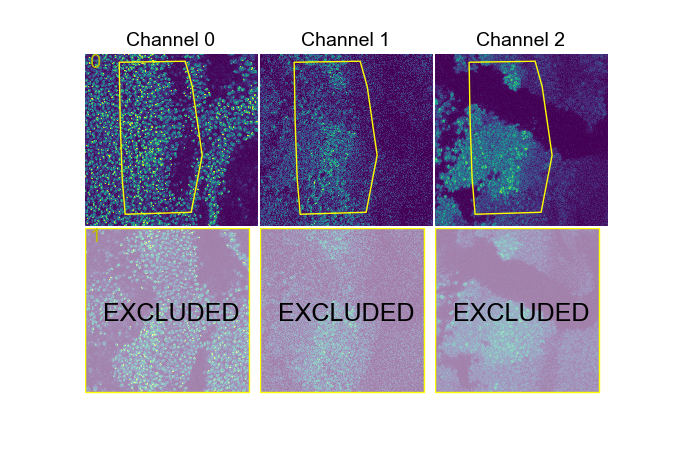
Example: ROI boundaries for two layers, one of which is excluded.
The GUI offers some basic key commands:
T: remove last added point
Y: remove all points in layer
W: save ROI selection
Q: exit GUI
When a selection is saved, a boolean selected attribute is added to the layer’s cell measurement data indicating whether or not a given cell lies within the layer’s selection path. The selected attribute may then be used to filter the measurement data during subsequent analysis. The GUI also allows the user to mark entire layers for exclusion using an additional key commands:
E: exclude entire layer
Layers marked excluded will be masked by a transparent overlay. When these layers are saved, the selected attribute is set to False for all of their constituent cell measurements.
A saved GUI may be reopened via the GUI.load method, at which point further adjustments may be made to each layer.
See the ROI selection documentation for additional details.
